This post was originally published on Coinspeaker
Bitcoin (BTC) price is trading above $74,000, while displaying an ascending triangle formation on the daily chart that technical analysts are characterizing as structurally bullish.
The analytical question is no longer whether Bitcoin has reclaimed critical support; it is whether the chart pattern carries sufficient confirmation to project the $90,000 target it implies, or whether the breakout is a tactical relief move that still lacks the on-chain and macro underpinning to sustain follow-through.
DISCOVER: Best crypto to buy right now – CoinSpeaker’s updated guide
The Ascending Triangle: What the Bitcoin Price Chart Structure Is Actually Showing
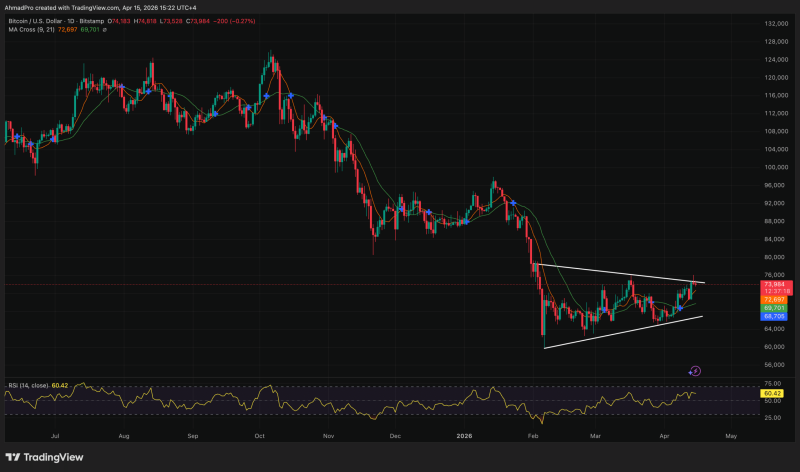
The pattern in question is an ascending triangle – a formation defined by a flat upper resistance boundary and a rising lower trendline, indicating that buyers are defending progressively higher lows while sellers concentrate around a fixed ceiling.
In Bitcoin’s case, the structure consolidated above $73,000 earlier in the week before the breakout move carried price above the $76,000 level, reclaiming territory not visited since early February 2026.
Source: Tradingview
The textbook signal from an ascending triangle is straightforward: the pattern implies that buying pressure is intensifying relative to supply at the resistance level, and a clean break above that ceiling projects a measured
— Read the rest of this post, which was originally published on Coinspeaker.